
Rainfall, Reservoirs and the Rabi Outlook

Monsoon 2026 season review
The 2026 southwest monsoon delivered 775 mm against a normal of 915 mm (−15%), making it a deficient season by IMD's definition. The shortfall was uneven in time and space: June failed badly (−35%), July was normal (+1%), August and September stayed below normal (−16%, −8%), and the first half of October was almost dry (−66%). The deficit is concentrated in the south (Karnataka, Andhra Pradesh, Telangana, Tamil Nadu), the east (Bihar, Assam) and Punjab, while Odisha, west UP and Uttarakhand ended normal or surplus.
Key insights
- Kharif yield risk is highest where rain failed late. Maharashtra had a good July (+40%) that drove sowing, then August (−46%) and September (−52%) failed during soybean pod-fill and cotton boll formation. Marathwada ended −44%.
- The south is short on both rain and water. Southern reservoirs hold 47% of capacity against a normal of 77%. Andhra Pradesh (−56%), Tamil Nadu (−51%) and Telangana (−49%) are far below normal storage. Srisailam, Nagarjuna Sagar, Somasila, KRS and Mettur are all below 55% of normal.
- North India has a storage problem despite near-normal rain in places. Northern region reservoirs are at 59% of capacity (normal 80%). Bhakra is at 75% of normal, Pong 82% and Thein (Ranjit Sagar) 61%. Punjab rain was −37%, so wheat will lean more heavily on groundwater.
- Central India is well placed. MP, Chhattisgarh, UP and Uttarakhand reservoirs are at or above normal (UP +21%), and Odisha storage is 14% above normal. These are the safest rabi regions.
- Harvest-time excess is a separate risk. West UP got +78% in September, and districts such as Gautam Buddha Nagar (+418% in Sep–Oct), Amroha (+200%) and Shahjahanpur (+179%) saw extreme rain on mature paddy, urad and bajra.
- Rabi outlook: mixed, with clear losers. Rainfed chana and rabi jowar in Marathwada, north Karnataka, Telangana and Rayalaseema face poor soil moisture and low dam levels. Wheat in MP and UP looks secure; wheat in Punjab-Haryana-Rajasthan is irrigation-stressed. A strengthening El Niño raises the risk of a warm winter.
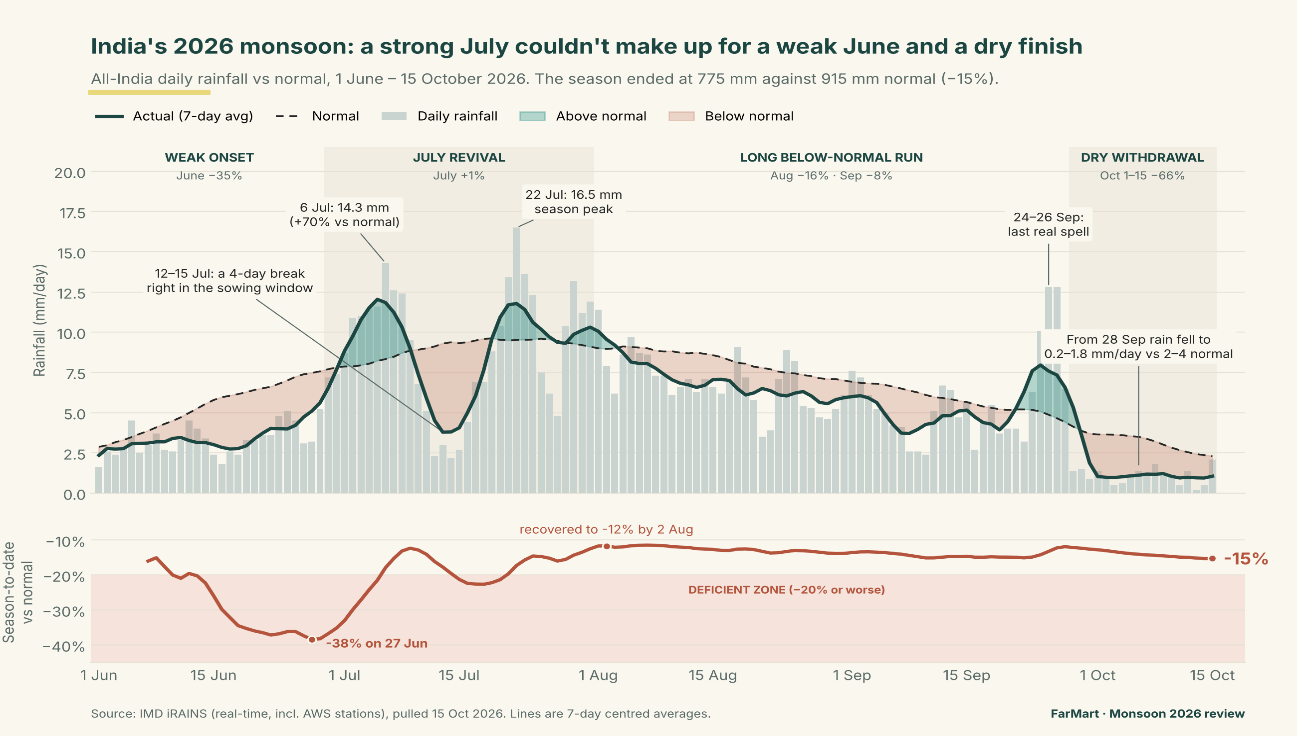
Figure 1. Daily all-India rainfall vs normal (top) and season-to-date departure (bottom), 1 Jun – 15 Oct 2026. Source: IMD
Month-by-month picture
- June: −35%. 107 mm against 165 mm. Sowing was delayed across central and south India.
- July: +1%. 283 mm against 281 mm. The only normal month; it carried kharif sowing.
- August: −16%. 213 mm against 255 mm. The month when the deficit hit the crop's vegetative and flowering stages.
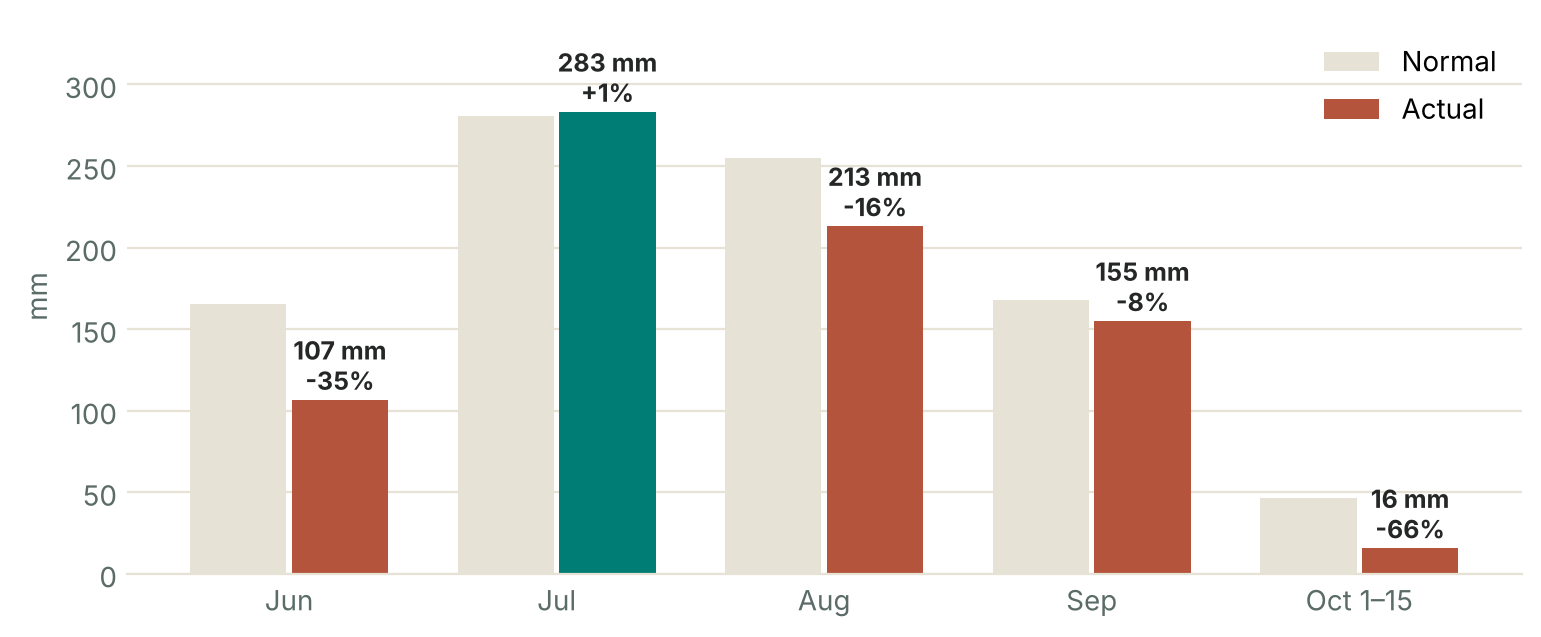
Figure 2. All-India monthly rainfall, actual vs normal. Source: IMD
State-wise monthly departure
| State | Jun | Jul | Aug | Sep | Oct 1–15 | Season |
|---|---|---|---|---|---|---|
| Maharashtra | −47 | +40 | −46 | −52 | −98 | −23 |
| Karnataka | −38 | −13 | −21 | −57 | −79 | −34 |
| Telangana | −9 | +3 | −49 | −24 | −97 | −24 |
| Andhra Pradesh | −5 | −57 | −52 | +15 | −85 | −33 |
| Tamil Nadu | +45 | −66 | −24 | −18 | −40 | −24 |
| Gujarat | −82 | +40 | −41 | +5 | −98 | −12 |
| Rajasthan | −6 | −21 | −33 | −9 | −85 | −23 |
| Madhya Pradesh | −33 | −5 | −5 | +19 | −98 | −7 |
| Chhattisgarh | −65 | +34 | −3 | +31 | −94 | +2 |
| Odisha | −47 | +83 | +15 | +39 | −86 | +22 |
| Uttar Pradesh | −54 | −16 | +24 | +65 | −40 | +7 |
| Uttarakhand | −37 | +9 | +4 | +65 | +32 | +9 |
| Bihar | −47 | −40 | −35 | −4 | −44 | −32 |
| Jharkhand | −59 | −11 | +27 | +14 | −60 | −6 |
| West Bengal | +2 | +2 | +4 | −4 | −74 | −3 |
| Assam | −27 | −27 | −18 | −44 | −54 | −30 |
| Punjab | −47 | −30 | −39 | −64 | n.m.* | −37 |
| Haryana | −29 | −27 | −7 | −44 | n.m.* | −21 |
* n.m. = not meaningful
When the rain failed: week-by-week by state
- Almost every state had a dry June. Most cells in the first four weeks are red.
- The 29 June – 6 July week was the turning point. Most states turned green, which is when sowing picked up.
- The Deccan stayed red from August. Maharashtra, Telangana, Andhra Pradesh and Karnataka had 6–8 consecutive below-normal weeks from early August to mid-September.
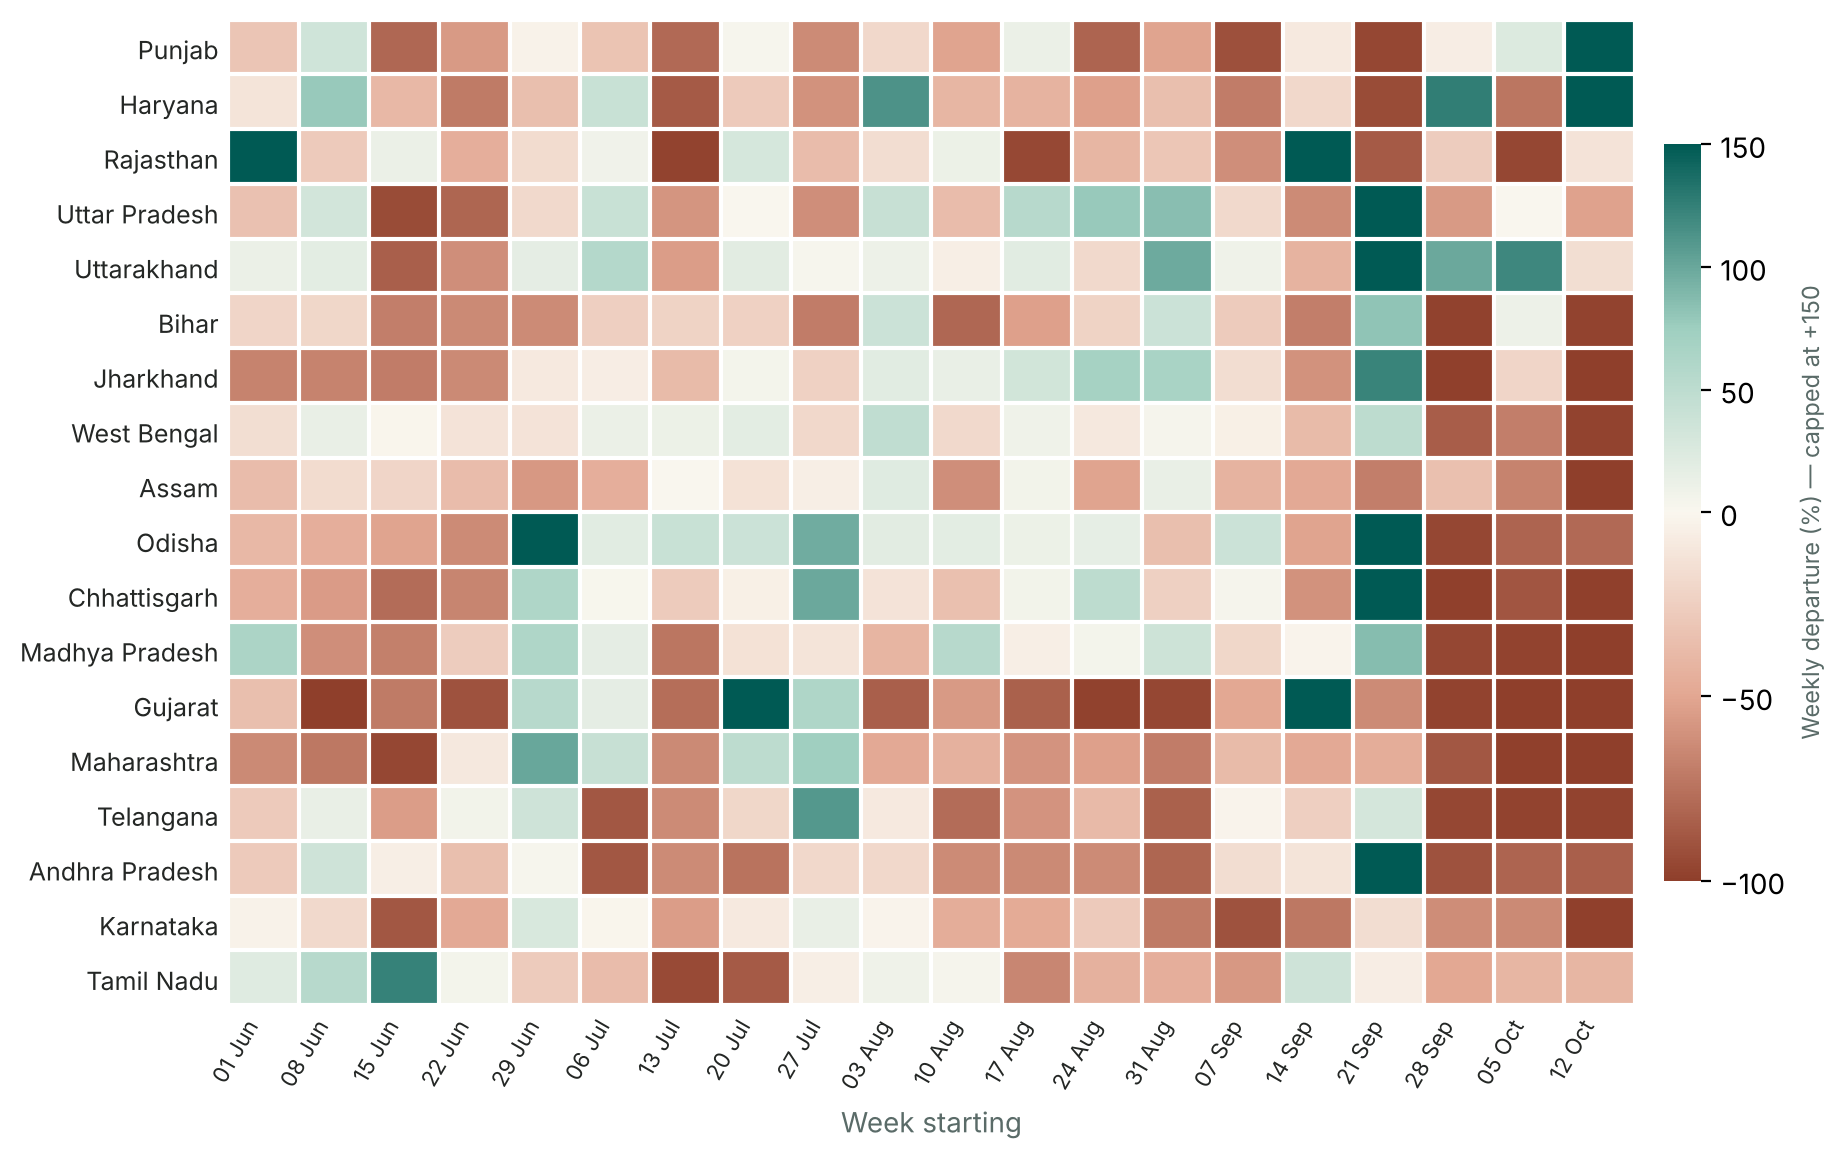
Figure 3. Weekly rainfall departure by state (red = below normal, green = above). Source: IMD
- The 21–27 September spell was widespread but too late for most kharif crops in the Deccan. It helped reservoir inflows in central India more than it helped standing crops.
- From 28 September the map turns uniformly red. The dry withdrawal hit every major state, which makes the rabi start dependent on stored water and residual moisture.
Impact on kharif crops
- Timing explains more than totals. States with similar season totals had very different crop outcomes depending on which month failed.
- Maharashtra and Karnataka: rain failed in August–September, exactly at pod-fill, boll formation and tur flowering. This is the most damaging pattern.
- Andhra Pradesh and Bihar: rain failed early (July in AP, June–August in Bihar), hurting establishment and transplanting.
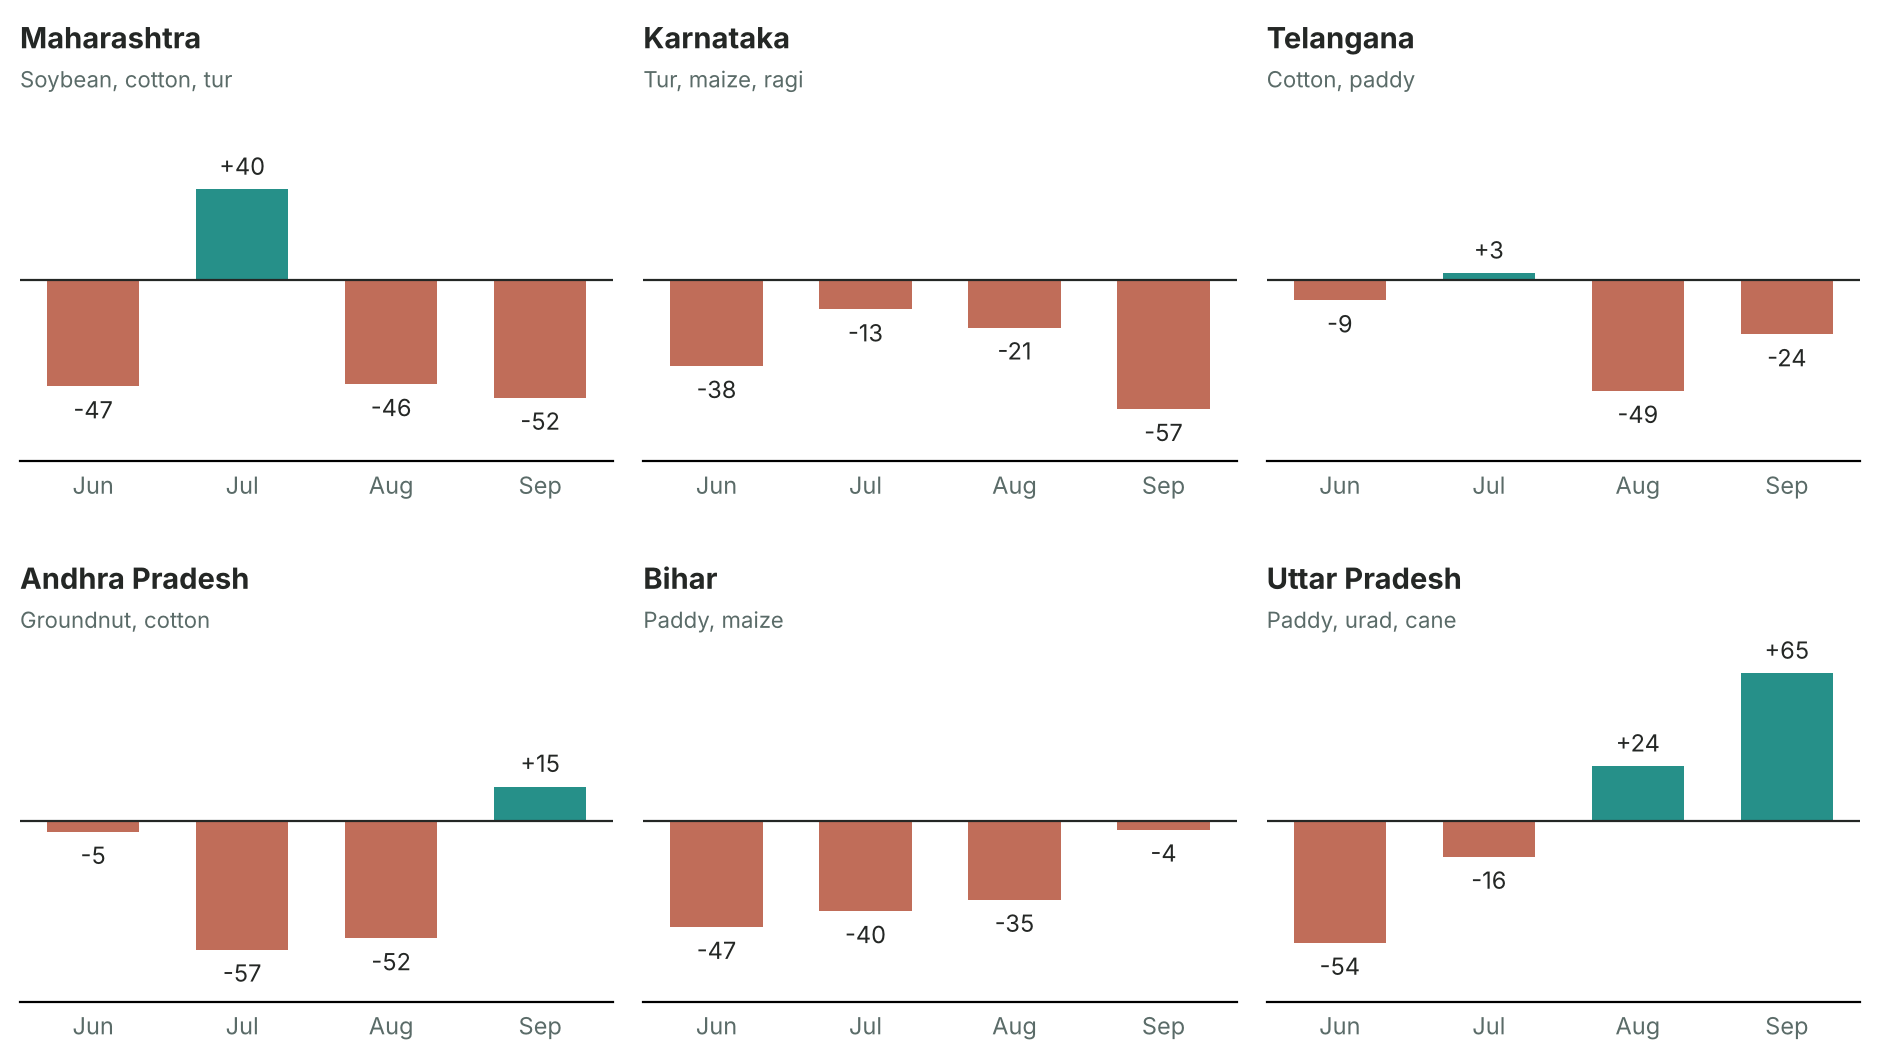
Figure 4. Monthly rainfall departure (%) in six key states, June–September. Source: IMD
Crop-by-crop assessment
| Crop | Regions at risk | What happened | Risk | Supply effect |
|---|---|---|---|---|
| Soybean | Marathwada, W. Vidarbha | Aug −46%, Sep −52% during pod-fill | High | Lower yields; thinner Latur/Akola arrivals Oct–Nov |
| Cotton | Marathwada, Vidarbha, Telangana, SW Punjab | Dry Aug–Sep at boll formation | High | Fewer bolls; slower kapas arrivals |
| Tur (arhar) | Kalaburagi, Solapur, Latur | Sep −57% (KA) at flowering | High | Smaller Dec–Jan crop |
| Groundnut | Rayalaseema, Saurashtra | Jul −69% (Rayalaseema), Aug −51% (Saurashtra) | Med–High | Patchy pod yields |
| Paddy | Bihar, Assam, E. UP / W. UP, Uttarakhand | Deficit in east; +65% Sep rain at harvest in north | Medium | Lower volume in east; moisture and quality cuts in north |
| Urad / moong | Bundelkhand, W. UP; W. Rajasthan | Harvest rain; deficit in Rajasthan | Medium | Discoloured grain; lower yield |
| Bajra | W. Rajasthan, Haryana | Aug −33% to −47% | Medium | Lower output in arid west |
| Soybean / maize (MP) | Madhya Pradesh | Near-normal Jul–Sep | Low | Near-normal supply |
| Paddy (Odisha, CG) | Odisha, Chhattisgarh | Jul–Sep surplus | Low (upside) | Good supply |
- The supply hit concentrates in pulses and oilseeds (soybean, tur, groundnut) and cotton, rather than in rice, where Odisha, Chhattisgarh and MP offset losses in the east.
- Quality, not just quantity, will matter in UP. Expect higher moisture and discolouration in paddy and urad arrivals from west and central UP.
Reservoir position and its link to rainfall
- All-India storage is below normal. The 178 reservoirs monitored by CWC hold 130.98 BCM (70.9% of capacity) as of 8 October. That is 87% of the 10-year normal and 79% of last year.
- The south is the problem region. Southern reservoirs hold 26.4 BCM, just 47% of capacity, against 77% normally and 89% last year (−39% vs normal).
- The north is also short. Northern region (HP, Punjab, Rajasthan) is at 59% of capacity against a normal of 80% (−27%).
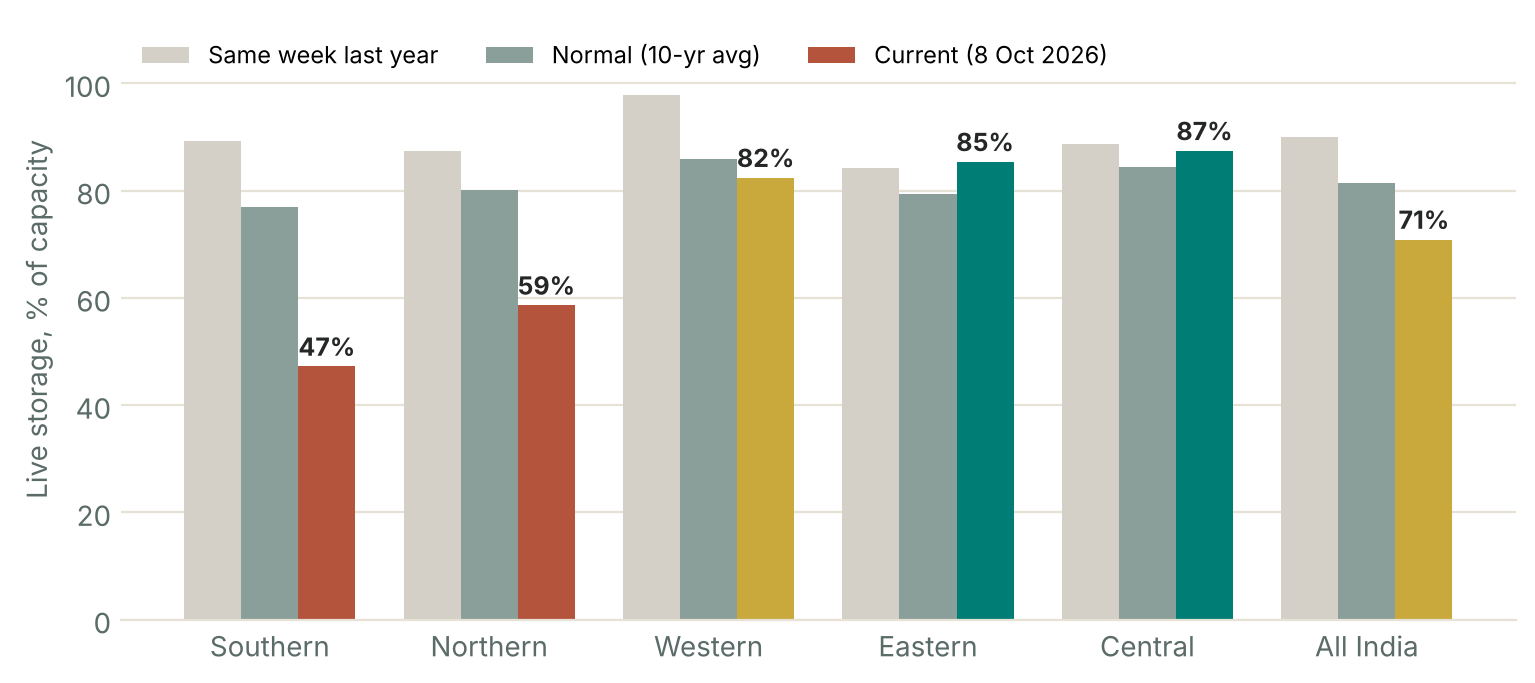
Figure 5. Live storage by region, % of capacity: current vs last year vs normal. Source: upag
Rabi outlook
- Rabi depends on three things: soil moisture left by the monsoon, water in reservoirs and groundwater, and winter conditions. 2026 is weak on the first two in the south and north-west.
- The dry October (−66%) means sowing on residual moisture will be harder for rainfed chana, rabi jowar, safflower and mustard.
- IMD reports a strong and strengthening El Niño. El Niño winters have often brought warmer-than-normal conditions in north India, which is a heat risk for wheat at grain fill in February–March.
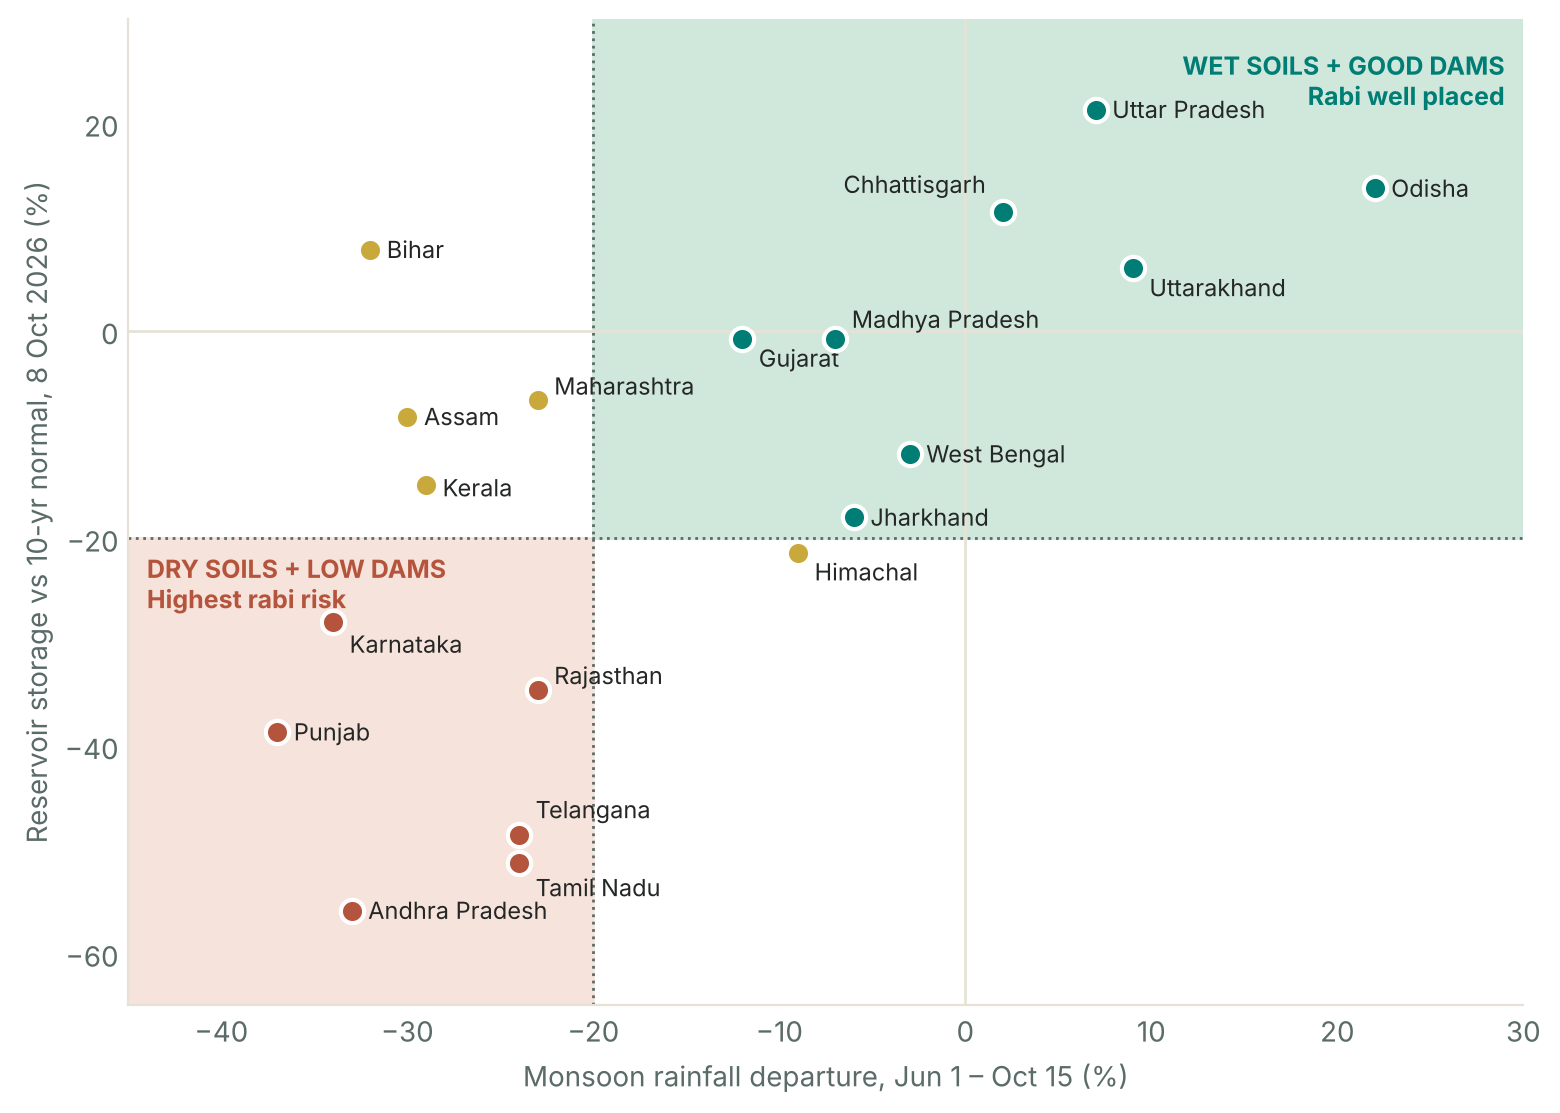
Figure 6. Rabi risk map: monsoon rainfall departure vs reservoir storage departure by state. Bottom-left = dry soils and low dams. Sources: IMD, CWC 8 Oct 2026.
Rabi risk by state
| Region / state | Soil moisture (rain) | Reservoirs | Rabi risk | Crops most exposed |
|---|---|---|---|---|
| Andhra Pradesh, Telangana | Deficient (−24% to −33%) | Very low (−49% to −56%) | High | Rabi paddy, maize, chana, groundnut |
| Tamil Nadu | Deficient (−24%) | Very low (−51%) | High (NE monsoon key) | Samba/thaladi paddy, pulses |
| Karnataka (north) | Deficient (−39% NIK) | Low (−28%) | High | Chana, rabi jowar, sunflower |
| Marathwada (MH) | Deficient (−44%) | Local dams critical | High | Chana, rabi jowar, wheat |
| Punjab, Haryana | Deficient (−21% to −37%) | Low (Bhakra 75%, Pong 82%) | Medium (groundwater) | Wheat |
| Rajasthan | Deficient (−23%) | Low (−35%) | Medium–High | Mustard, chana, wheat |
| Bihar, Assam | Deficient (−30% to −32%) | Near/above normal (small) | Medium | Wheat, maize, lentil |
| Gujarat | Below normal (−12%) | Normal (Sardar Sarovar full) | Low–Medium | Wheat, cumin, chana |
| Madhya Pradesh | Near normal (−7%) | Normal | Low | Wheat, chana |
| Uttar Pradesh, Uttarakhand | Normal/surplus; harvest rain | Above normal (+6% to +21%) | Low (sowing delays in W. UP) | Wheat, potato, mustard |
| Odisha, Chhattisgarh | Surplus/normal | Above normal | Low | Rabi paddy, pulses |